


The Evidence View provides a table-based view of the node types (concepts) linked to the search results.
Evidence View table header definitions:
| Header | Description |
|---|---|
| Omit/Add | Remove/Add as ConceptID to Keyword search |
| Type | Evidence type |
| Node label | Evidence name/description |
| P-Value | Statistical significance (P-Value) |
| Genes | Genes in Knowledge Graph related to your search |
| Gene List | Genes in your Gene List related to your search |
| Select | Select gene (for creating networks) |
Filtering results
The various evidence node types (GO, TO, phenotype, pathway, gene, publication, etc.) matching the search terms are summarised in the key/legend, with a count of how many of each (Figure 1). The key is interactive and can be used to filter the results by selecting one or multiple evidence types in the key. Clicking the refresh button resets all filters.
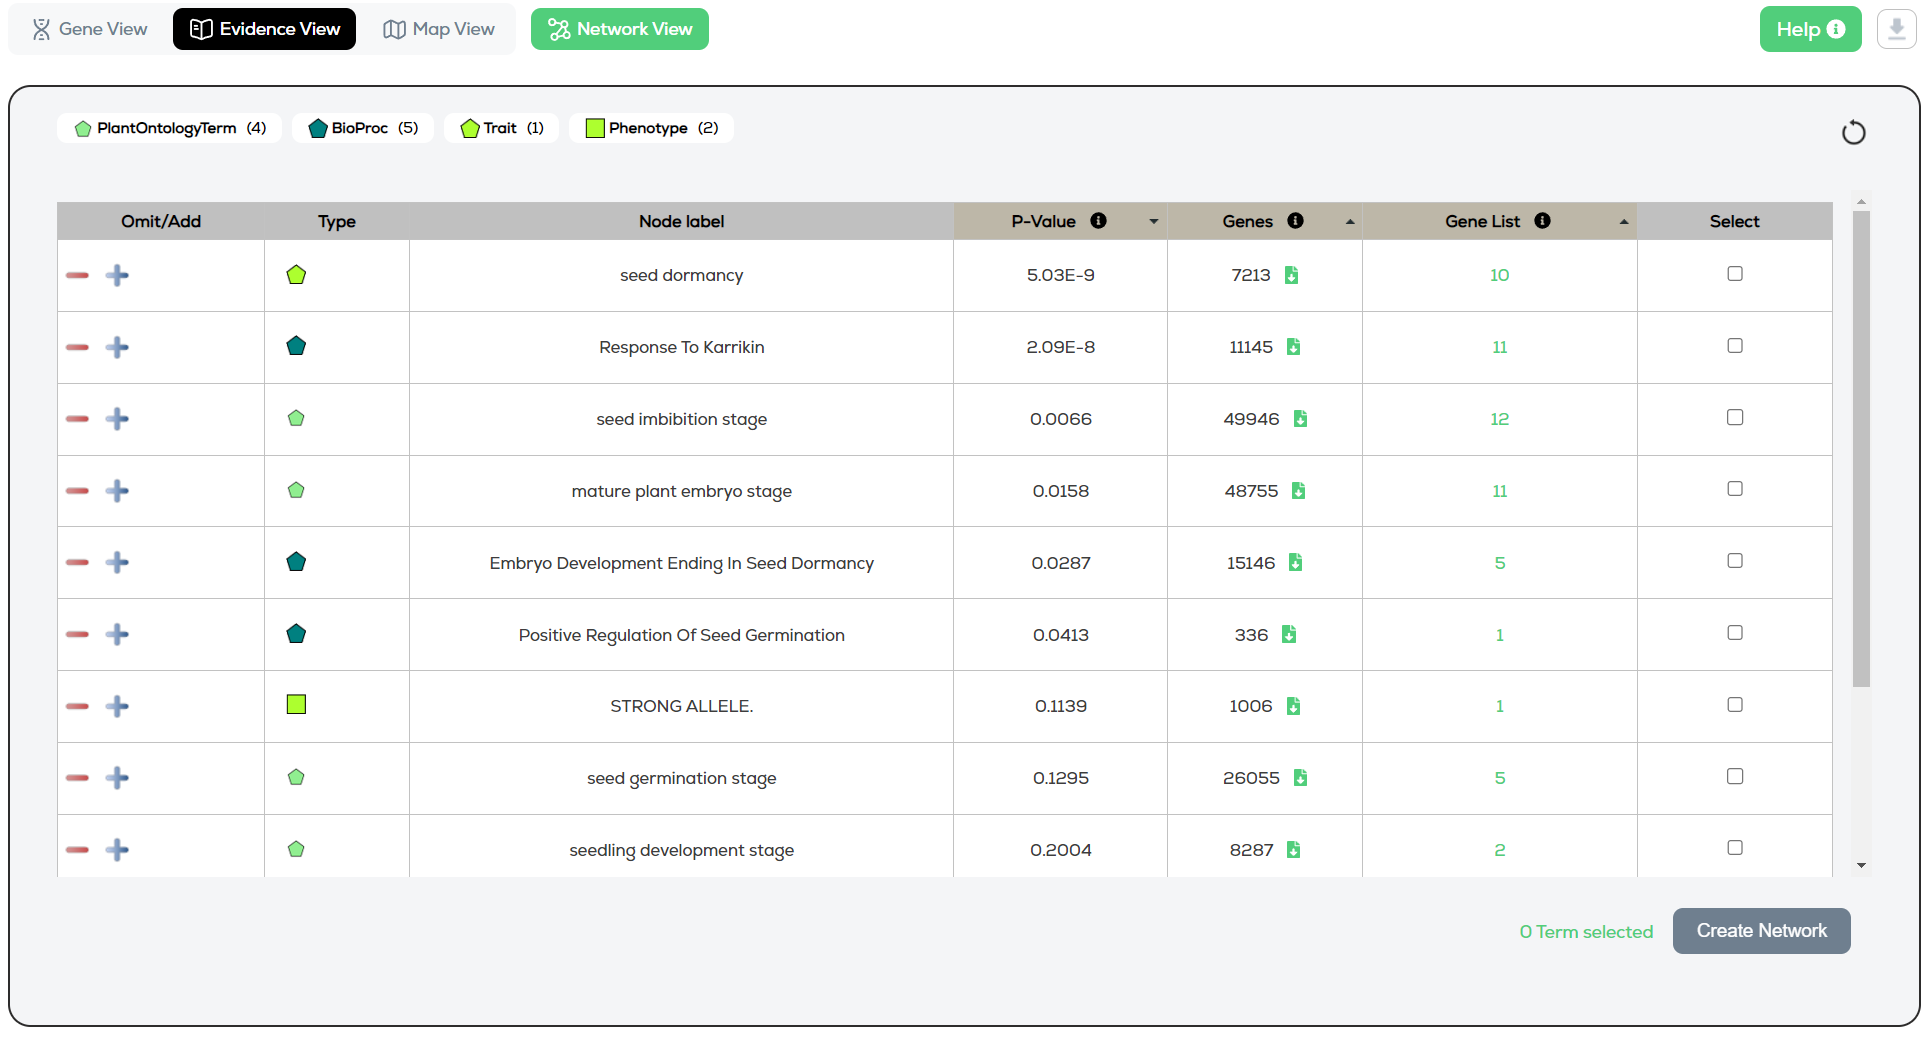
Figure 1 – Evidence view
Table ordering explained
The results are default ordered according to P-Value->Gene List->Genes.
This is because when the user did not provide a Gene List, the P-Value and Gene List columns are not available. Instead, they then read: “N/A” and “0”.
Creating a Network
Select one or more concepts and click “Create Network”.
Omit/Add functionality
Omit/Add allows users to re-query the knowledge graph by replacing their current Keyword search with more specific ConceptIDs.
1. Click Omit or Add on one or more concepts.
2. Optionally, add any additional keywords to the Keyword Search.
3. Optionally, either include a Gene List or Genome Region.
4. Run the search.
Displayed results will be significantly more specific to your Concepts, as KnetMiner is now removing any ambiguity from using English words to search the Knowledge Graph and can instead rely on exact pairings.
Gene List functionality
The “Genes” column now contains a green file clickable icon beside each row’s count (see Figure 1).
Clicking the button displays a table containing a list of genes in the full knowledge graph, found to be matching the graph node specified under “Node label”. The table will only show up to 500 genes, with the full table visible by downloading (top right of popup) or the full gene accessions copyable with the “Copy gene accessions” button (Figure 2).
Copying the gene accessions allows for easy pasting into the Gene List search box on KnetMiner, for querying again.

Figure 2 – Evidence view