


The Network View displays knowledge networks of one or multiple genes selected from the previous views.
– The entry gene (your genes of interest which were selected in one of the prior Views) is displayed as a blue triangle with a double border.
– Evidences/concepts are represented as Nodes on the interactive graph, each with a type (such as “gene”, “protein”, “SNP”).
– Edges (node relationships), also have types (such as “encodes”, “published_in” and “occurs_in”) connect nodes. start from the entry gene(s) and travel towards another node will provide a relationship, initially showing only the most relevant relationships to the search term.
– Dotted lines indicate text-mined and similar evidences (and should generally be taken with a grain of salt – read the Evidence within the connection by using the context wheel menu as shown above).
– Nodes connected with solid lines were imported from databases and score more reliably. We encourage using both relationship types and always reading related evidences.
Most node types also link to their accessions (at the bottom of the info box), allowing for more in depth search, confirmation and citing individual resources and KnetMiner.
Controls
Main buttons (from top left to top right)
ButtonDescription
| Toggle full screen | Toggles on/off full screen mode |
| Show all the concept & relations in the Network | Adds all “hidden” but significant evidences to the network |
| Show info box | Toggle the info box to the right side of the screen |
| Re-run the layout | Re-runs the currently selected layout |
| Reposition (reset and re-fit) the graph | Repositions the graph to fit all on screen concepts |
| Network layout | A dropdown list of the various available network view layouts |
| Label visibility | Global toggle for displaying concepts/relations labels |
| Label font size | Change the font size of all labels |
| Go to help documentation | Brings users here (https://knetminer.comknetwiki/network-view) |
| Download icon | Download in either Tabular or Cytoscape JSON formats |
| Save to your workspace on KnetSpace | Saves your current KnetWork for sharing and further editing |
Additional Controls
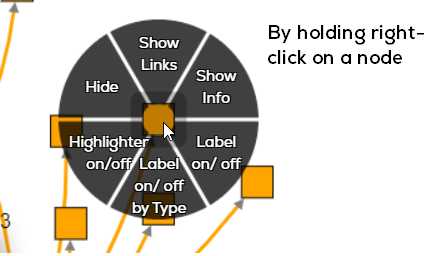
To view information regarding any concept (node), or its relationship (edge), hold the right click button on the node/edge and a wheel
(context menu) will appear.
Click ‘show info’ to see an information table on the right of the network viewport. You can close this by clicking the ‘X’ button in the
info-box. To reset the orientation (zoom) of the graph, click the reset button. The info button next to the ‘CoSE layout’ drop down menu can
also be used to show the info box (you must then click a concept to show information for it). You can move concepts and edges to be more easily viewable.
You can also hide concepts, show their labels or hide by their specific type by using the same wheel.
Interactive legend
To use the interactive legend;
– Double click a concept to remove the concept.
– Single click to add concepts of that type up to the point where they are ‘hidden’ behind another label.
– The concept count will also update to show the current number of concepts present on the graph over the total number, updating as added or removed.
– The number of concepts and relationships visible are shown below the interactive legend, and the total number are shown adjacent to them in brackets.
On a touchscreen device
Gently flick up on the legend concept to remove the concept and tap to add.
Downloading a network
As of 5.6, KnetMiner supports two download formats:
| Format | Description |
|---|---|
| Tabular Format | Downloads visible genes from KnetWork as a table |
| Cytoscape JSON | Downloads visible graph in Cytoscape JSON format |
Downloading in Cytoscape format requires some setup, which can be
found here.
More info
Gene names are displayed with their species name prefixed, generally in two-letter capital+lowercase format.
– For example: Triticum aestivum = Ta, so gene CHS in wheat would be called TaCHS.
– This is only available pending data availability.
If the data is unavailable and you want to know with which species a gene is linked; follow “Controls”.
Please note, if a network you are trying to create contains >100 publications, only the most recently published 100 will be shown in Network View.

Figure 1 – Knowledge Network. View this KnetWork interactively here