


The Map View is a chromosome-based display (Figure 1).
– Useful for locating where your gene or SNP lies on a species’ chromosomes.
– Allows for quick exporting of PNG files for use in publications (see: “Exporting as a PNG” below)
The visuals: explained
– To the right of the chromosome are all the genes which are related to the search term(s). Coloured horizontal lines distinguish genes, with green for high scores, orange for medium, and red for low.
– SNPs are shown to the left as the highlighted squares, colour coded according to the study shown in the SNP legend, relating to evidence found for the SNP.
Visible Centromeres
Centromere positions are shown as grey horizontal lines.
– They are only visible in species containing the data and where the search resulted in genes being shown on the chromosome band of interest (no centromeric positions will show if there are non genes on the band) (Figure 2).
– The position data is added manually from journal articles where available. Where unavailable we sometimes use bioinformatic methods to infer their positions as accurately as possible. They are meant to be used as a general visual guide.
Creating a Network
Select one or more genes (from the right of individual chromosomes) and click the “Launch Network View” button at the top left of the Map View interface.
Map view with region search
You can also specify a region search and only show genes and SNPs within this region.
Exporting as a PNG
Clicking the floppy/save icon in the top interface bar allows for quickly saving the interface as a PNG.
What is currently on screen is what will be saved.
Controls and settings
You can zoom in and out and side to side interactively using the mouse. The p-value (how significant the association of the gene is with the search term) can be altered via the settings option (cog icon). Right clicking SNPs will provide further information in a pop-up box, where the selected SNP/QTL can be hidden or displayed, as shown below. Genes can be selected in the Map View and opened in Network View by clicking the network icon on the top (far left).
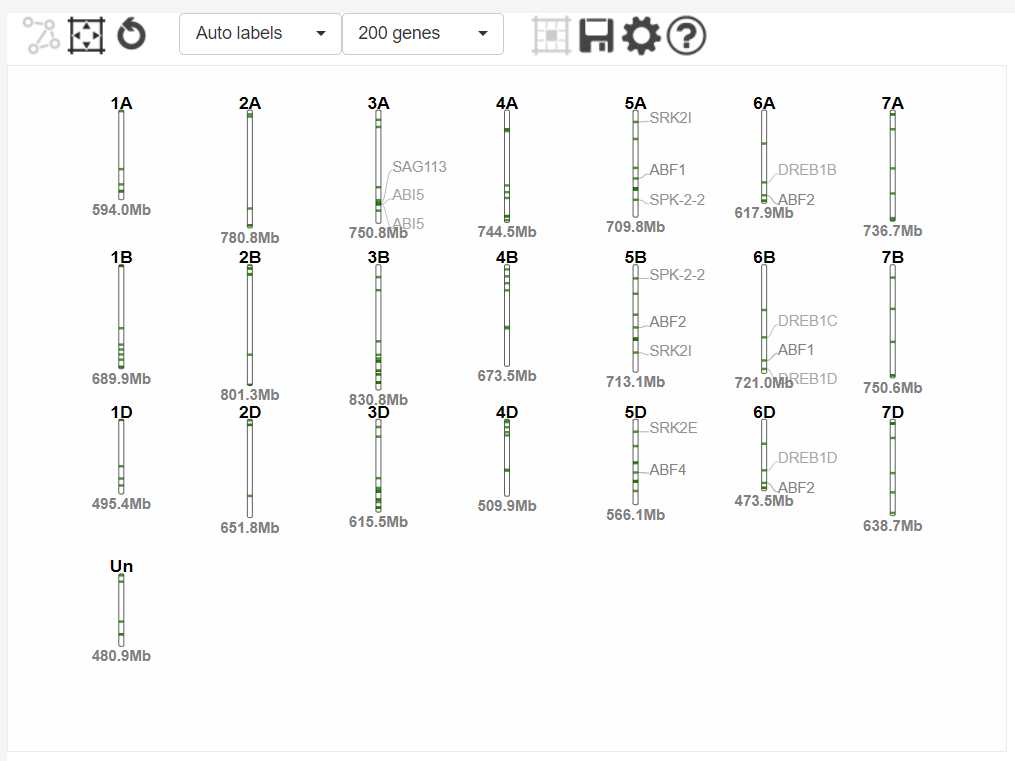
Figure 1 – Map View
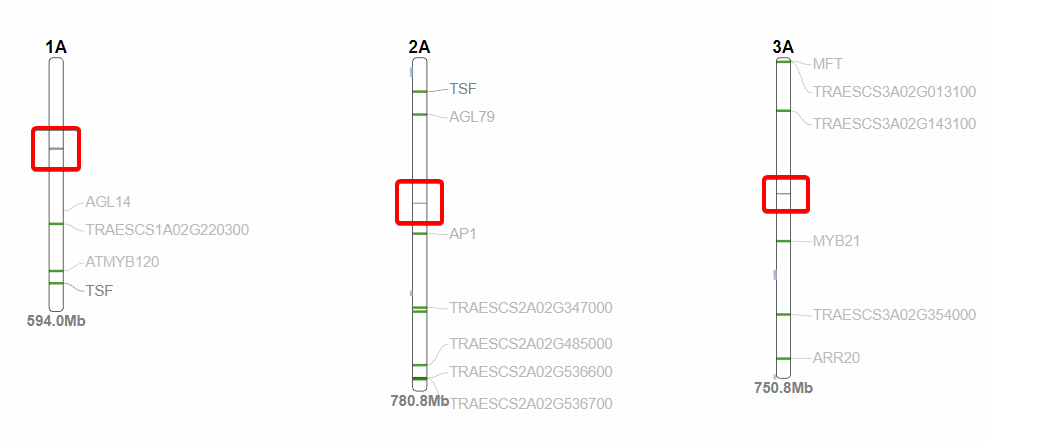
Figure 2 – Centromeres in Map View